In brief:
- Benchmarking finance can help you take advantage of areas of opportunity to automate, reduce staff, restructure, and increase focus on more strategic activities.
- Not all benchmarks are created equal. Finding the proper alignment of business traits will help you effectively measure the health and quality of your operations.
- While top performer sounds like a natural goal, expected ROI will help you determine if embracing the median level is more realistic.
- Always view benchmark data in context of the entire operational picture before drawing conclusions and action plans to avoid a false picture of performance.
Leveraging industry benchmarks to “rate” the services provided by your finance function against your peers can be a valuable step in understanding the existing health and quality of your finance & accounting (F&A) operations.
By benchmarking your finance department size and cost, you can uncover areas of opportunity to restructure your organization, take advantage of automation, reduce staff, and increase focus on more strategic activities. But are all benchmarks created equal? Do general industry measures reflect the specific characteristics and dynamics of your business?
There are many resources like the American Productivity & Quality Center (APQC) that provide the finance & accounting department size benchmark and other critical measures, including data that is segmented by various business demographics (industry sector, revenue size, geography, public vs. private, etc.) Most break down this data into levels such as Top Performer (75th percentile and above), Median Performer (50th percentile), and Bottom Performer (25th percentile and below) – aimed at helping you understand where you are today and where you can reasonably aspire to get.
But to utilize the benchmarking process effectively, you need to find the proper alignment of business traits. For example, comparing a publicly traded retail organization to a privately held professional services firm is not going to present an effective measurement – reflecting vastly different operational and regulatory complexities and transaction volumes.
Determining where you are situated compared to benchmark levels without understanding the underlying business characteristics would not be a valuable form of analysis.
In this blog, we will help you understand how to use financial benchmarking to determine the optimal size and cost for your F&A department – providing two real-world examples of how we helped companies use key financial metrics to drive greater efficiency and performance.
Benchmarking finance: Should your goal be top performer?
Most people naturally want to target the top performer level for their organization, but is this realistic?
When you look at the characteristics of a top performer, you will likely find an organization that has standardized its business processes and systems, limited the number of variations and exceptions in its transactions, simplified its business rules, and implemented automation solutions to reduce the amount of manual work. It has made significant investments in its operations, and the ROI was considered sufficient to warrant that investment.
Top-performing AP teams process more than three times the number of invoices than bottom performers, according to APQC benchmarking data. The cost per invoice processed is also almost four times higher in a bottom-performing organization.

Top performer sounds like a great place to live, doesn’t it? But can you afford the mortgage and upkeep?
Most F&A departments are happy to be “moving on up” from the tenements of bottom performer to the more upscale median performer neighborhood. Realistically, median is where most organizations find themselves (hence the term), and if you are not there yet, it is a great (and attainable) goal.
If you are at the median performer level, then it becomes a question of ROI – is it worth it to invest in the technologies, process changes, and organizational restructuring needed to elevate your performance level? It can be costly and difficult to get there, so carefully consider your drivers, expected outcomes, and level of payback before embarking on this path.
Automation widens the gap between top and bottom performers
It used to be enough to periodically compare performance against benchmarks but with the recent market trends and advancements in automation, you could be missing out if you don’t check more often. With rapidly changing technology innovations, it is important to have good visibility into your operational performance and productivity to see how well your automation efforts are working.
For example, benchmarks for the number of full-time equivalents (FTEs) required to do the work of a finance organization are going down, thanks to automation picking up many of the manual tasks typically associated with these roles. Automation, increasingly powered by AI, allows mundane and repetitive tasks like data entry, invoice processing, and accounts receivable receipt processing to be executed with minimal human intervention.
The median productivity level for accounts payable (AP) FTEs who manually enter less than 25% of invoice line items is almost twice that of FTEs who manually key in 75%, according to data from APQC.
This drives operational efficiency, enabling finance teams to shift resource allocation toward more strategic and analytical roles, such as interpreting financial data and advising business decisions. APQC reports AP organizations with higher degrees of automation show 24% lower staffing levels than those without.
But while APQC points to mature automation efforts as a key reason the gap between top and bottom performers is widening, it also emphasizes automation is not a magic bullet for peak performance.
Top performers maximize automation results by combining innovation with process optimization that standardizes and streamlines process steps, as well as analytics that drive continuous improvement and informed decision-making.
Using finance benchmarking metrics to optimize your organization
Understand that benchmarks are data points, one part of a broader analysis that must be undertaken to clearly identify if the way your organization is structured is optimal. However, sometimes those data points are like neon signs illuminating areas of opportunity, pointing to where a focused analysis can provide details needed to solve problems.
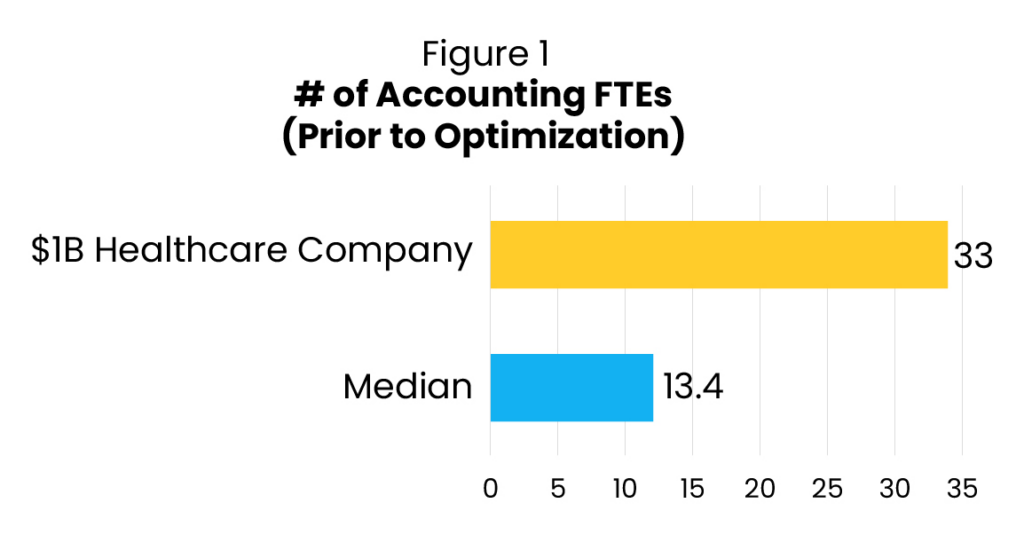
Consider a $1B healthcare organization with an accounting department of 33 people – more than double the industry median performer benchmark of 13.4 FTEs, according to APQC (see Figure 1). This makes them a bottom performer.

But is this an “apples-to-apples” comparison? The healthcare company maintains more than 70 clinics that generate its revenue, compared to other healthcare organizations comprised of a few large hospitals. Greater geographic diversity brings additional operational and regulatory complexities, significantly higher transaction volumes, and overlapping staff at the various locations – all driving additional headcount.
By compiling and analyzing the healthcare company’s volumetric data, the Auxis team determined each of the 70+ clinics needed to reconcile 40-50 general ledger (GL) accounts monthly – for a total of 3,000 accounts. The regional operational structure created inconsistencies in the way accounts were structured and treated. Accounts were also reconciled manually, using Excel.
Combined, these factors created a time-consuming, grueling process – one that stretched the month-end closing cycle to the middle of the next month.
The median performer benchmark for managing GL accounts is 28 accounts per FTE. If you do the math using that benchmark, the company needed more than 100 FTEs to reconcile all its accounts monthly – considerably more finance employees than it currently had in its accounting department!
As a result, accountants were not reconciling every account every month. Considerable time was spent cleaning up issues with the unreconciled accounts, with staff generating numerous journal entries to resolve variances.
Many errors required re-work and extensive oversight. The accounting organization was spending all its time reconciling, correcting, updating, and closing – leaving no time for any type of analysis or business insights.
The benchmark pointed us in the right direction, and a further, rather quick analysis highlighted the root causes of the issues. The solutions were readily apparent (and not that complicated):
- Standardize the account structure and reconciliation process across all locations
- Reduce the number of accounts reconciled monthly, focusing on the most material accounts
- Implement an automated account reconciliation platform such as BlackLine, Trintech, OneStream, etc. to reduce the manual work needed to manage these accounts, focusing just on variances
- Reduce the number of journal entries created by the effort to clean up unreconciled accounts
- Restructure and streamline the accounting organization, bringing a more structured and focused process with the ability to provide real-time quality control and oversight.
Meeting the finance team size benchmark: What’s the impact?
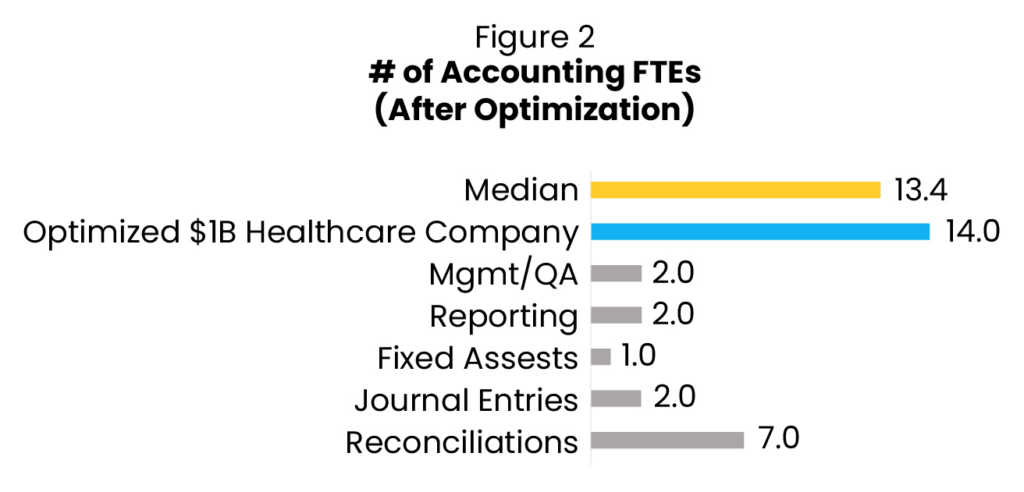
As you can see in Figure 2, the organization was able to considerably reduce the number of FTEs from 33 to 14, which is just about the median performer benchmark.

While the company’s complexity prevented it from becoming a top performer in terms of FTEs, the process and efficiency improvements that brought it to the median level are considered a big win.
You generally don’t want to risk making too big of a jump (i.e., from bottom performer to top performer) because you don’t want to be too disruptive to your operations at once. Optimization can take time, and people need to adjust to changes.
It’s better to gauge the impact of your initial actions and be prepared to take further steps after the operational dust has settled as you become more aligned with your benchmark targets.
What’s the takeaway? Benchmark data by itself did not provide the answers to help this company optimize its accounting operation, but it clearly showed us where to look to optimize efforts.
Too often, organizations can’t “see the forest for the trees” as they are so busy running on that treadmill, and they can’t take a step back to analyze what is really going on. Benchmarking can help you to “see the trees,” and, in particular, see which ones need to be chopped down.
Look below the surface of benchmarking in finance to find real solutions
Sometimes benchmark data can give you a false impression of your operational performance. Always view data in context of the entire operational picture before drawing conclusions and action plans.
Consider a $250M property management company that operates approximately 400 residential properties across multiple geographies. Due to the nature of its business, the company manages (and pays) a large number of vendors across its properties. Its 15,000 monthly invoice volume equates to a consumer-packaged goods (CPG) or retail company with more than four times its revenue.
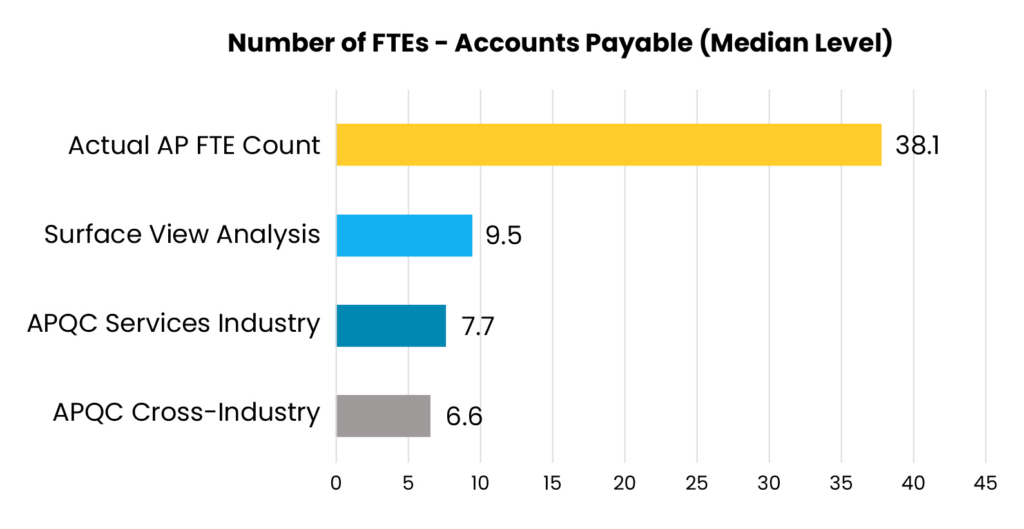
On the surface, the company appears to be doing a good job with its AP function. With 9.5 FTEs, its processing productivity approaches the top performer range (achieving 1,500+ invoices per FTE per month). Its AP headcount is also just above the median performer level of 7.7 FTEs for the services industry.

But a deeper dive into the company’s operations tells a different story.
Actual invoice processing occurs at individual properties, where 18 administrative assistants located in the buildings receive, index, code, and enter invoices into the AP system. Since they are not dedicated AP staff, the company had excluded them from its AP headcount.
However, an Activity Survey found they spend a considerable amount of time handling invoices, while the corporate AP team is solely focused on managing invoice exceptions and processing payments. The Activity Survey also found the decentralized structure forced 10+ members of the company’s accounting team to spend time on research, reclassification, and cleanup of errors happening at the properties such as miscoded or erroneously processed invoices that weren’t being caught by the AP team.
In reality, the actual number of FTEs allocated to AP processing was 38, way below the bottom performer level for its industry.

Such great inefficiency created a ripple effect on other critical industry benchmarks as well:
- Adding up the actual cost of all the company’s AP resources placed its cost per invoice at $17.18 – nearly three times the industry median benchmark of $5.80.
- With excessive time consumed by AP activities, the accounting team only had bandwidth to handle 15 properties per accountant, below the industry median benchmark of 20. This impacted overall productivity and property support, while hindering the team’s ability to provide operational insights, scale and grow the operation, and for onsite team members to deliver exceptional customer service to residents.
This is a case where a surface-level review of benchmark data would have failed to provide great insight into the company’s operational challenges. A deeper dive was needed to understand the true nature of the issues it was confronting, and to understand the “spill over” effect into other impacted areas.
Starting with benchmarks gives you an idea of where things lie on the surface; it’s up to your team to then consider all angles that may be leading to a “false positive” result.
Using finance benchmark data to drive an action plan
In the example above, “cleaning up” the AP area would drive significant improvements across the entire F&A organization. But how could the company do this without incurring significant cost increases?
Moving AP processing from the properties to the corporate AP team seemed like an easy fix. But the median benchmark shows you need about 15-16 people to process these invoices (at ~1,000 invoices processed per FTE).
At a fully loaded cost of about $70,000 per FTE, that would result in a cost increase of more than $1M. (Remember, property staff also performed other duties so you would not be replacing any of them to grow your AP team.) This was obviously untenable.
Incorporating an automated AP processing solution with Intelligent Document Processing (IDP) enabled the company to target 70% “touchless” AP processing, leaving only 30% requiring manual inputs. As a result, the company only had to add five AP processors to handle the remaining 4,500 invoices.
The new cost per invoice (including the cost of automation and additional AP staff): $4.94, about 15% below the median industry benchmark of $5.80.
More importantly, these improvements allowed the company to free up the equivalent of eight accounting FTEs from AP-related tasks, delivering a “soft” annual cost savings of about $1M by eliminating the need to hire additional accountants. The company also was able to increase the number of properties per accountant to 20, the industry median benchmark!
This real-world example reveals how benchmark data guided an organization into taking action to improve its finance operations, validating those actions had meaningful results.
Benchmark data can provide you with good insights into the current state of your F&A operation and serve as a roadmap to future efficiencies. They provide intelligence on where your key operational challenges reside.
They should not be used as standalone metrics to drive an efficiency program. But given the need of F&A organizations to be leaner, scalable, and flexible, they can be an important part of a broader analysis to help shape that program and measure its outcomes.
Looking to improve the performance of your Finance & Accounting Department? Schedule a consultation with our finance transformation experts today! Or, visit our resource center to learn more finance transformation tips, strategies, and success stories.


