


In brief:
- An effective and efficient accounts receivable department is vital as improving cash flow remains a top CFO priority in 2024.
- Tracking the right metrics can uncover performance issues and help you strategically improve AR processes while lowering costs.
- Learn 6 important accounts receivable KPIs every organization should track – and smart strategies for achieving peak performance.
High-performing accounts receivable (AR) operations are vital to steady cash flow, as persistent macroeconomic uncertainty keeps cash flow management a top CFO priority in 2024, states the American Productivity & Quality Center (APQC)’s Finance in Focus report. But maximizing performance requires a clear-eyed view into how your collections process is tracking – and where improvement is needed.
Inefficient AR processes, invoicing bottlenecks, re-work, and errors delay your organization’s access to cash and create poor customer experiences. At the same time, 8 in 10 companies are experiencing outstanding payments from customers in today’s economic climate – making AR efficiency more important than ever.
Using key performance indicators (KPIs) to uncover challenges and strategically improve your AR process enables better liquidity and working capital management: helping organizations speed access to cash, improve the average accounts receivable balance, recover delinquent accounts, apply collected payments on time, and resolve disputes without damaging customer relationships.
Accounts receivable performance metrics: are you a top performer?
No single key performance indicator reveals everything you need to know about how your collections efforts are performing. Ultimately, the AR metrics you choose should reflect what matters most for your business.
But six key benchmarks stand out as essential to improving efficiency and effectiveness in your Order-to-Cash (O2C) organization:
1. Days Sales Outstanding
Deemed the top metric for evaluating AR performance, Days Sales Outstanding (DSO) tracks how quickly your customers pay their bills. This KPI is closely linked to cash reserves and liquidity – making it an essential metric to track amid economic uncertainty.
After all, the faster you are paid the money you are owed, the more breathing room for your organization.
Tracking DSO helps CFOs identify bottlenecks in their AR process, enabling corrective actions and best practices before issues turn into bigger concerns. DSO also provides insight into customer satisfaction and creditworthiness.
To calculate the days sales ratio: divide your total AR balance by your net credit sales and multiply by the number of days in the period you are measuring. For example, if you have a total AR balance of $10,000 and credit sales of $50,000 in a 30-day month, your DSO is 6 for that month.

The lower your DSO, the better your AR performance. If your DSO is high, your team is not collecting revenue fast enough – and your cash flow is probably suffering. For businesses with seasonal sales or sales that fluctuate often, calculating DSO per quarter instead of per month helps normalize your data and spotlights trends over time.

So, what’s a good number? The median DSO across every organization is 38 days, according to APQC data. But what constitutes a “good” score varies across industries: for instance, the median DSO in the healthcare industry is 38 days but in the retail sector, it’s 32. Benchmarking your business against others in your industry creates the most accurate assessment of performance.

2. Total Cost of Performing AR Processing Per Customer Receipt
This measure looks at the amount of money you’re spending to collect each payment and book the cash application, reflecting how well your AR costs are managed.
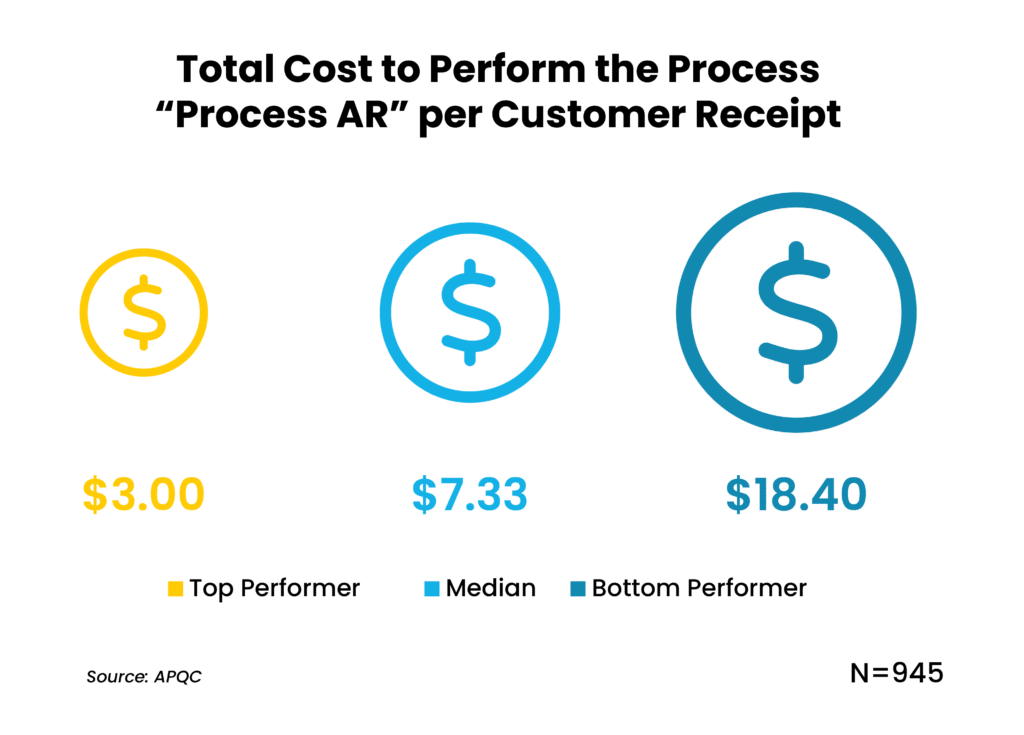
Cost-effectiveness can be measured in several ways. For example, APQC benchmarks AR organizations based on the total cost of performing AR processing per customer receipt.
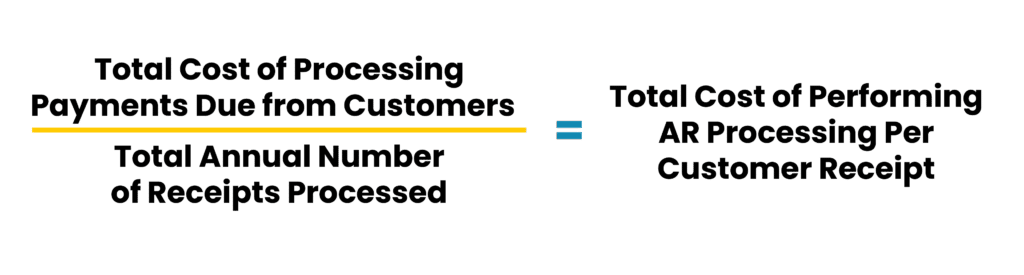
To calculate your cost-effectiveness: Divide the total cost of processing payments due from customers (think: personnel, systems, labor, outsourcing, etc.) by the total annual number of receipts processed.
The lower your number, the better your performance.
As shown in the graph below, bottom performers (representing the bottom 75th quartile) spend more than six times what top performers (the top 25th quartile) spend to process and apply customer payments.
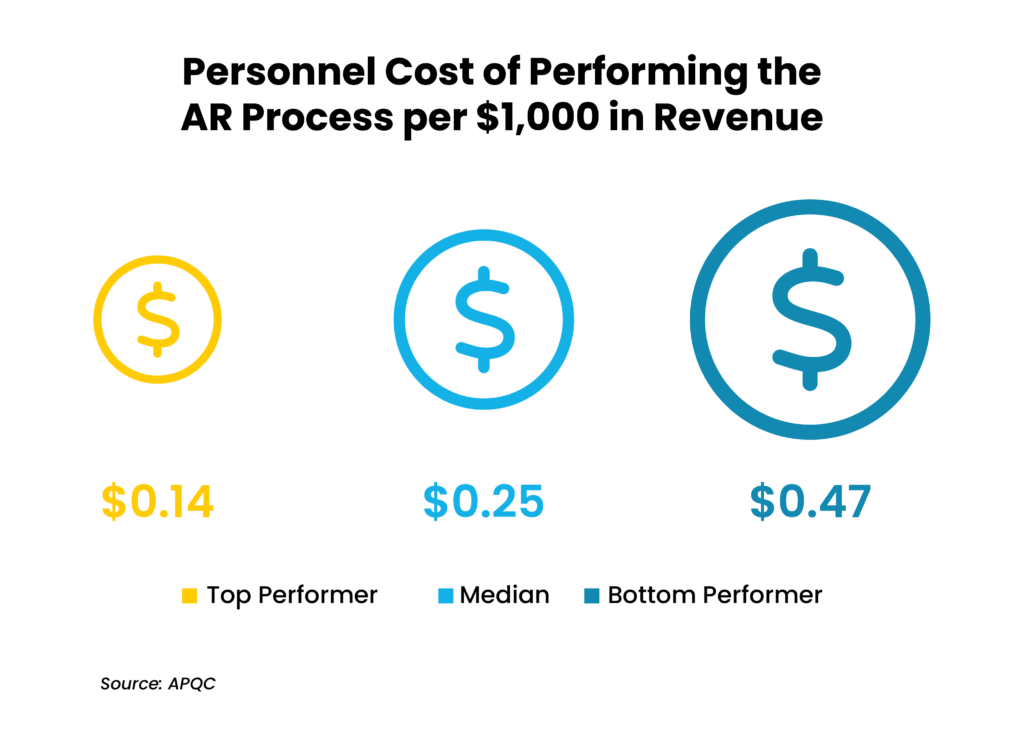
3. Personnel Cost of Performing the AR Process Per $1,000 Revenue
Measuring the personnel cost of performing the AR process per $1,000 revenue can also shine light onto your organization’s cost effectiveness. Personnel costs can include employee salaries, bonuses, benefits, and more.
Once again, the goal is to keep your number low so you don’t lose money on your collection efforts. Increasingly, finance leaders are leveraging the power of AR automation tools like UiPath to lower collections costs, automating time-draining tasks like payment reminders, document processing, aging invoice reports, transaction matching, pricing deductions research, and more.
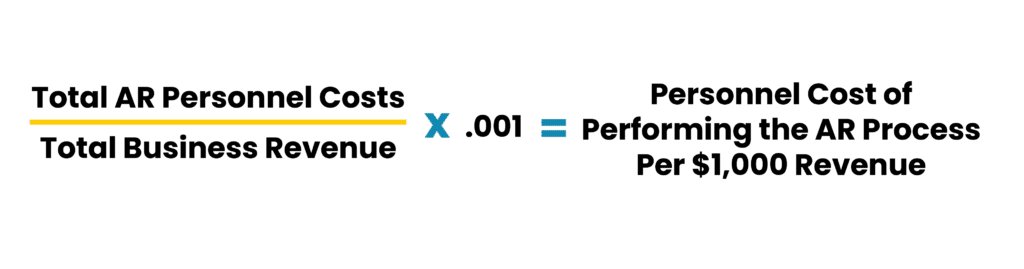
To calculate this metric: divide your total AR personnel costs by business revenue and multiply by .001.
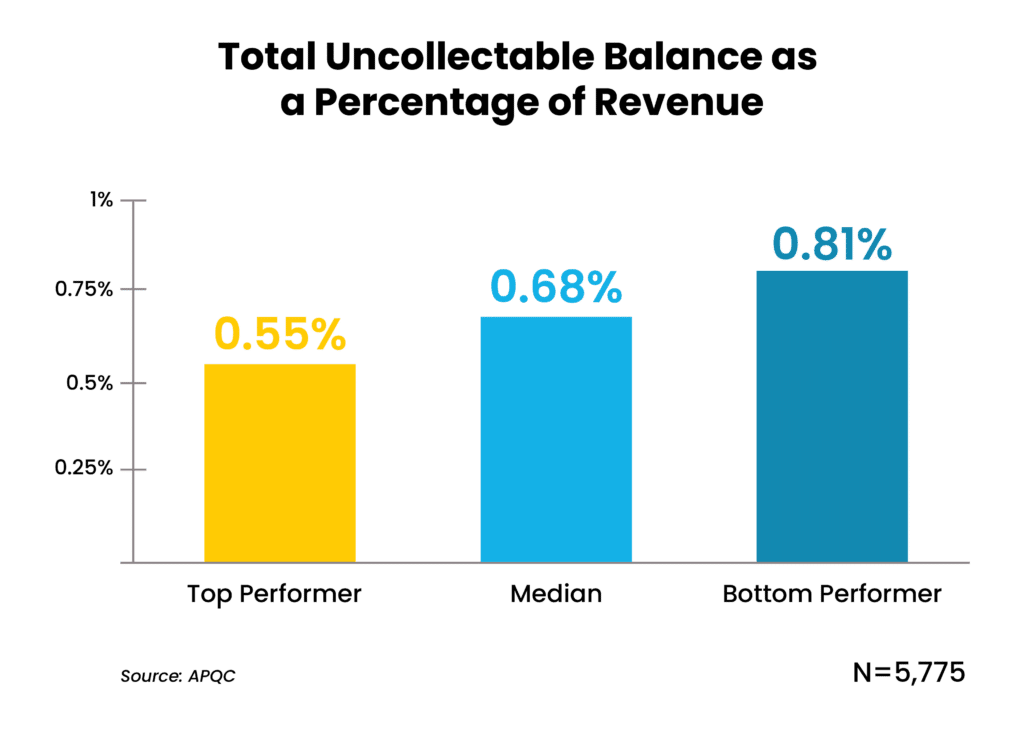
4. Total Uncollectable Balances as a Percentage of Revenue
Understanding how much bad debt you hold is key to keeping a close eye on cash flow. A debt is considered “uncollectable” after all reasonable methods of recovering outstanding invoices were made.
Tracking your total uncollectable balances as a percentage of your revenue is another important measure of AR efficiency. While the benchmark percentages below seem negligible, they can add up quickly – especially for larger enterprises.
Consider: Based on these benchmarks, a bottom-performing company with $1 billion in annual revenue risks more than $8 million in uncollectable balances. Improvements that bring it to the median range could potentially save more than $1 million.
Here’s something else to keep in mind: while APQC recommends benchmarking performance relative to your peers, measuring this metric internally is just as important. While it is not unusual to see uncollectable balances tick upward in tough economies, knowing where you stand relative to three months ago and a year ago can uncover patterns, high-risk accounts, and the presence of bad debt that improve cash flow decisions.
To calculate this metric: Divide the total value of your uncollectable balances by business revenue and multiply by 100.

5. Number of AR FTEs per $1 Billion in Revenue
This metric breaks down the number of full-time equivalents (FTEs) an AR organization requires to process payments due from customers, normalized by $1 billion in revenue. The less staff it takes to do the job well, the more efficient your team.
According to APQC’s cross-industry benchmark data, bottom performers need more than twice as many FTEs as top performers to do the same amount of work. With personnel expenses comprising nearly 60% of the finance function’s operational costs – right-sizing your organization can go a long way toward controlling expenses.
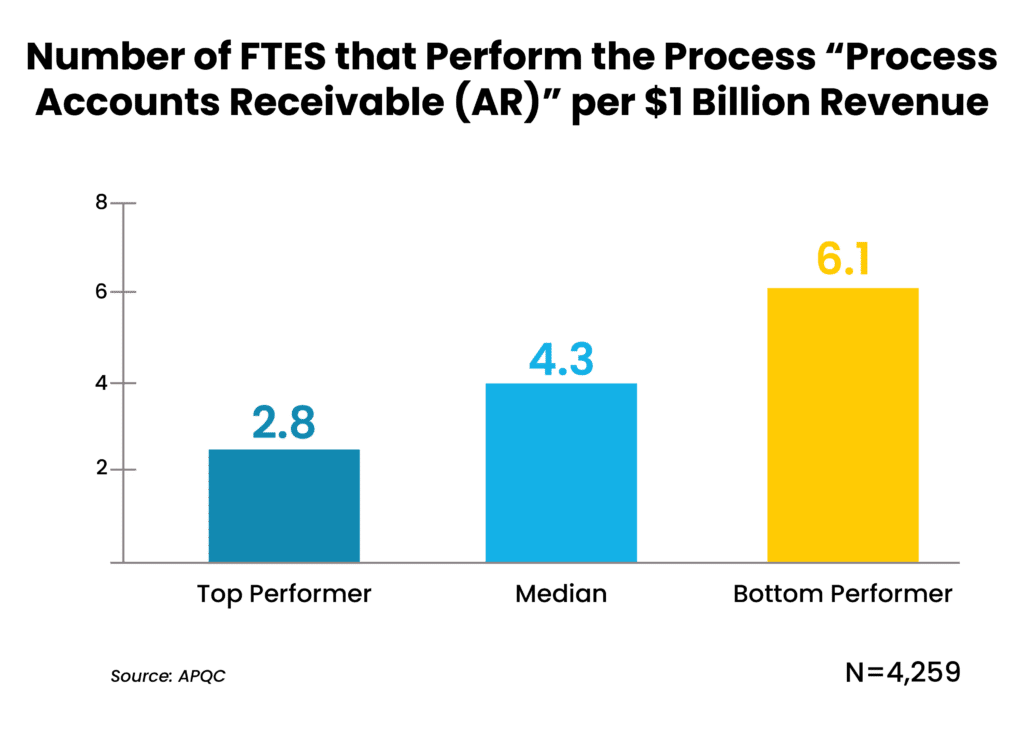
Of course, different industries may require different headcounts. A healthcare provider with thousands of patients and voluminous, insurance-related accounts receivable would fall behind with only 2.8 FTEs, but a billion-dollar construction company with a limited number of projects per year paid by a small number of customers could function successfully.
Benchmarking your performance against organizations within your industry paints the most accurate picture of where you stand. To calculate this metric: Divide the number of FTEs who perform your AR process by your total business revenue and multiply by .000000001.

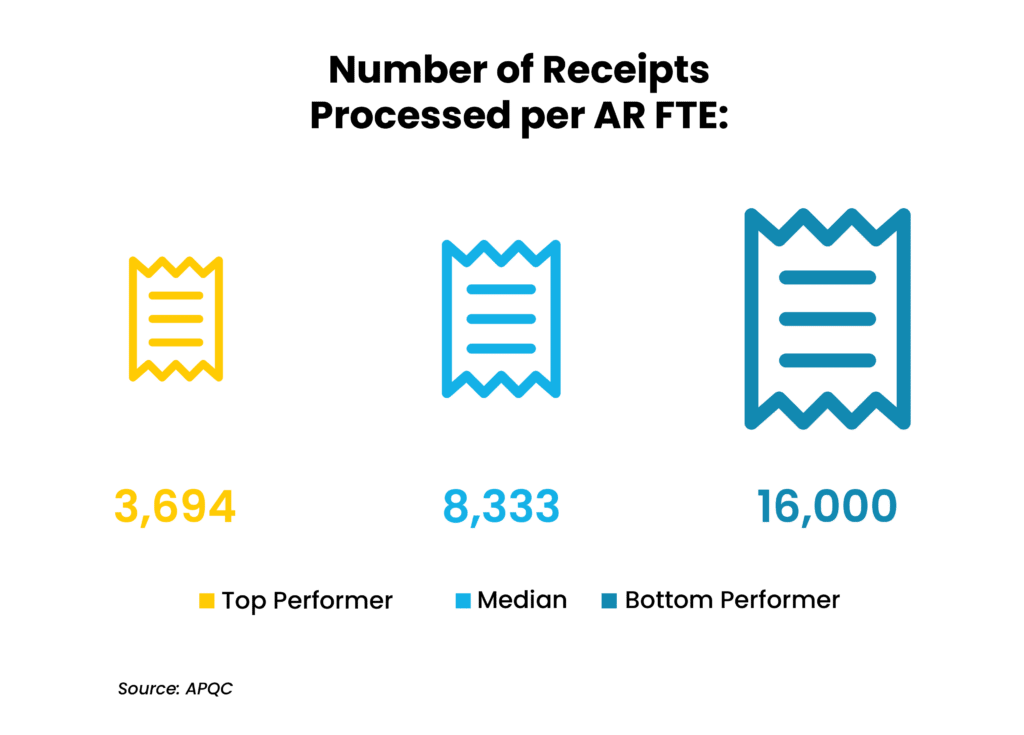
6. Number of Receipts Processed per AR FTE
This final metric spotlights staff productivity, measuring the number of receipts processed per AR FTE. It considers all the actions involved in processing payments from customers – helping AR organizations assess its team’s efficiency.
Top performers process more than four times as many receipts as bottom performers, according to APQC data. That huge discrepancy crystallizes the tremendous impact of process automation on AR organizations.
Said Steve Player, APQC’s senior research fellow in financial management: “Over time, we’re seeing the disparity grow between those with automation and those without. The computer is handling a lot of the work to enable top performance.”
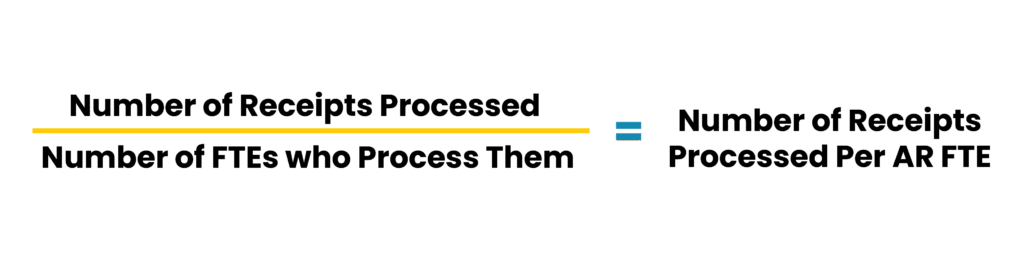
To calculate this KPI: Divide the number of receipts processed by the number of FTEs who process them.
3 smart strategies for improving AR performance
AR represents one of the most high-volume processes in a finance organization – and improving your team’s efficiency and effectiveness can pay off exponentially in productivity and cost savings. These smart strategies go hand-in-hand with performance management to help you boost performance:
1. Centralize accounts receivable delivery
Organizations with multiple locations often leverage shared services centers (SSCs) to consolidate high-volume processes like O2C. Implementing a dedicated team in a centralized location standardizes the way the process is performed – ensuring greater consistency, improving process governance, increasing digitization, and accessing economies of scale that boost efficiency and lower costs.
2. Get your data house in order
Nearly 40% of finance leaders cite siloed data and legacy systems as the biggest challenge inhibiting their collections process, according to the Shared Services & Outsourcing Network’s (SSON) AR Pulse Check Survey.
Centralizing accurate and up-to-date customer data into a single source of truth is key to successful payment collection, consolidating billing address, purchase details, payment status, trends, financial health, and more. This strategy avoids payment delays due to avoidable errors like invoices sent to the wrong place, supports effective communication, and helps you proactively address potential payment challenges with customers.
3. Leverage AR automation
Nearly 60% of finance leaders say replacing manual tasks with automation is their top AR priority, the SSON report states. When implemented properly, automation is a key strategy for reducing the critical Days Sales Outstanding metric while lowering costs by speeding and streamlining the AR process, the SSON report states.
That can mean maximizing automation capabilities in your enterprise resource planning system (ERP) or applying automation tools to workflows, manual data entry, payment matching, e-invoice generation, receipt processing, and more. Creating automated self-service portals and encouraging electronic payments further increase AR efficiency, eliminating manual inputs and steps.
Finance leaders are also starting to explore the immense potential of AI to improve AR effectiveness – personalizing collections strategies, driving efficient deductions processing, supporting real-time, predictive analytics that improve cash flow forecasting, and more. More than 60% of organizations anticipate significant impact from AI across the finance function in the next two years, according to Everest Group’s 2023 AI in Finance & Accounting report.
Why Auxis: Improving cash flow and elevating customer experiences
Even if top-line revenue is trending up, an inefficient AR process can leave you light on the working capital that keeps your business growing. Tracking the right accounts receivable KPIs provides critical insights into the strengths and weaknesses of your collections process – enabling informed, data-driven improvement strategies.
But siloed, manual processes and legacy systems often prevent finance departments from optimizing their AR process effectively. Not surprisingly, accounts receivable ranks as the second-most outsourced business function.
Auxis brings a proven track record of helping AR organizations collect payments faster and smarter – standing out as a Major Contender and the only true nearshore player on Everest Group’s 2023 PEAK Matrix assessments of Order-to-Cash and Finance & Accounting Outsourcing providers.
Auxis’ turnkey accounts receivable outsourcing services in Latin America deliver real-time collaboration and high-level, cost-effective finance talent that functions as a seamless extension of your internal team. Auxis also comes to the table with best practices, more than a quarter-century of finance transformation experience, and cutting-edge technology like intelligent automation, Generative AI, machine learning, and analytics that shift resources away from time-draining transactional activity toward high-value work.
Top-performing AR teams understand that success boils down to maximizing efficiency and effectiveness. The right outsourcing partner can help you build a strategic, cost-effective AR organization that avoids impacts to cash flow while elevating customer experiences.
Want to learn more about the benefits of accounts receivable outsourcing? Schedule a consultation with our AR experts today! You can also download of complimentary copy of Everest Group’s PEAK Matrix® for Finance & Accounting Outsourcing (FAO) Services 2023 Assessment to learn why Auxis was recognized as a Major Contender and Nearshore Leader. Or visit our resource center for more AR tips, strategies, and success stories.